
 Bitcoin: Fear And Greed Index
Zoom in with touchscreen: Touch and hold with ONE finger then drag.
Zoom in on desktop: Left click and drag.
Reset: Double click.
What Is The Fear And Greed Index?
The Fear and Greed Index is a tool that helps investors and traders analyze the Bitcoin and Crypto market from a sentiment perspective. It identifies the extent to which the market is becoming overly fearful or overly greedy. Hence why it is called the Fear and Greed Index.
The idea is that when the market is generally overly fearful, it may indicate that Bitcoin is cheap/undervalued at that time and could present a good buying opportunity.
The reverse also applies, so when the Fear and Greed Index is signaling market participants are extremely greedy, it may indicate the price of Bitcoin is too high above its intrinsic value and it could be a good time to sell.
Why Is The Fear And Greed Index Useful For Investors And Traders?
Understanding the scores from the Index could present an opportunity to the astute investor to buy when the market is overly fearful and sell when the market is extremely greedy. Thereby potentially improving their investment decisions.
This indicator would show red numbers and state 'extreme fear' when market sentiment is extremely negative. It would show green numbers and 'extreme greed' when sentiment and market momentum are extremely positive.
The Fear and Greed Index can therefore act as a useful emotional management tool. Allowing the investor to separate their own emotions from the rest of the market and avoiding any irrational reaction to sudden price movements and market volatility. This is especially the case when it is used alongside other tools that use different data inputs from the market, many of which can be found here.
How To Use Fear And Greed Index To Understand Market Sentiments
The Fear and Greed Index uses a simple 0 to 100 scale and is color-coded for ease of use.
When the score is red and close to zero this signals extreme fear and could indicate that many Bitcoin ($BTC) investors and crypto investors are too concerned about the price dropping further. At such a point in time, crypto fear is high and investors may not be thinking rationally.
When the score is green and close to 100 this signals extreme greed and could indicate that many investors of Bitcoin ($BTC) and crypto are too excited about the prices rising a lot further in the future.
Specifically, The Bitcoin Fear & Greed index can be broken down into four categories of market sentiment:
0-24: Extreme fear (red)
25-46: Fear (amber)
46-49: Neutral (yellow)
50-74: Greed (light green)
75-100: Extreme greed (green)
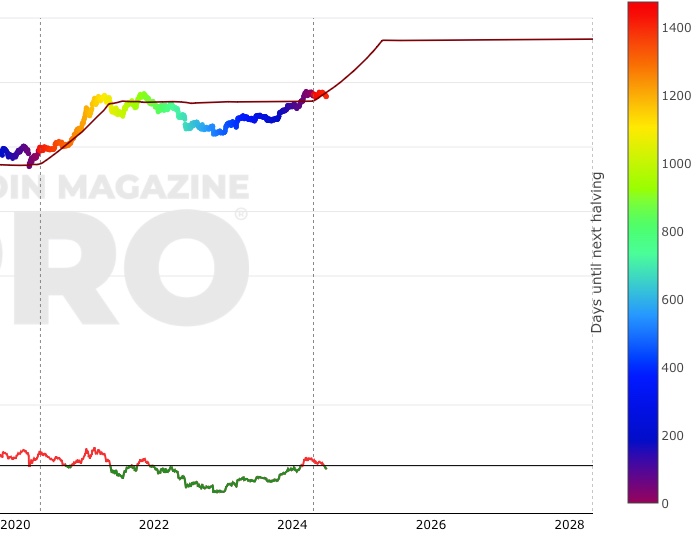
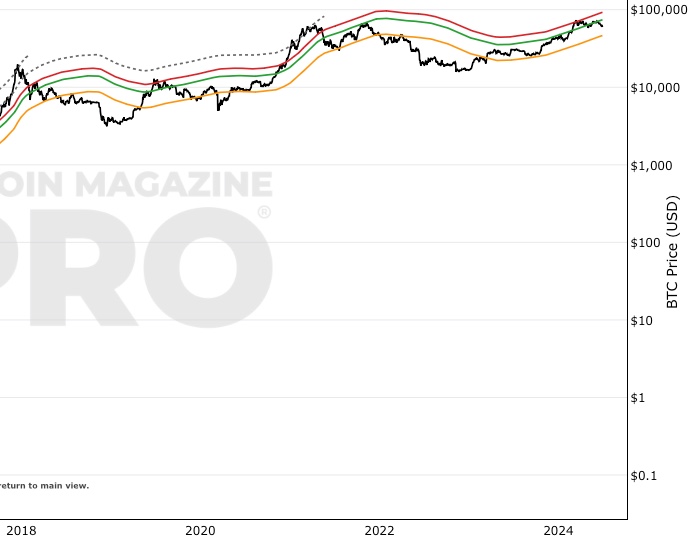
How To Interpret The Fear And Greed Chart
Above, we not only show the Bitcoin index score but also overlay it on top of the price of Bitcoin on the chart. The benefit of this is that it allows you to see not only the current score but also to see how the score has changed with price over time.
This adds a new, unique dimension to the Bitcoin Crypto Fear and Greed Index that allows investors to understand how the Index interacts with price historically.
This can only be found on this page and is not on any other website we know of that has information about the Fear and Greed Index.
This feature is particularly useful for investors because it allows you to see how sentiment changes with prices over time. This can be useful for the investor to help manage their own emotions in the market when the price of Bitcoin is either moving up or down a lot.
We will continually update this live chart every day so you can come back to see how the Bitcoin Fear and Greed Index is changing alongside the price of Bitcoin over time.
We hope you enjoy using this unique and free feature.
Data Source Inputs For Generating The Fear and Greed Index Chart
The inputs for the Fear and Greed Index are generated every day from several different sources. Each one is relevant in its own way and contributes to a greedy definition and to help define fear within the greed and fear index.
They include:
- Current volatility of $BTC price action, relative to the last 30 days and 90 days. Exceptional increases in volatility can sometimes be a sign of an overly fearful market.
- Momentum and Volume, relative to the last 30 days and 90 days. Exceptionally high buying volume on a relative basis can indicate that the market is becoming overly greedy.
- Social media sentiment analysis looking at sentiment type and volume at a given time relative to historical norms.
- Dominance of Bitcoin relative to other cryptocurrencies.
- Google Trends across a range of relevant Bitcoin search terms to identify strong periods of growth or decline in Google Search.
Fall Further Down The Rabbit Hole
If you would like to learn more about the Fear & Greed Index head over to Alternative.me where they also have general pricing information about Bitcoin and a range of other cryptocurrencies.
In addition to the Fear and Greed Index, other market sentiment charts that use alternative data sources can be found here. In particular, Relative Unrealized Profit / Loss specifically looks at sentiment and complements the above approach as it uses on-chain data, which the above approach does not.
This chart view for the Fear and Greed Index was first shown by @cryptopou
Free Widget Code For Your Website
We have made the Fear and Greed Index available to embed on your website for free. You can simply copy-paste this code and your users will be able to see the Fear and Greed Index latest score update on your site every day. By default, the widget's width will be set to 100% of the width of the container it is included within, but this can be changed by adjusting "width:100%" in the code below.
    <div id="fear_and_greed" style="width:100%">
      <a href="https://www.lookintobitcoin.com/charts/bitcoin-fear-and-greed-index/" target="_blank">
      <script src="https://cdn.plot.ly/plotly-latest.min.js"></script>
      <div id="header"></div>
      <div id="plotly_app"></div></a>
      <script type="text/javascript" src="https://www.lookintobitcoin.com/widget/fear-and-greed/"></script>
    </div>
You May Also Be Interested In

Bitcoin Cycle Master
A combination of on-chain metrics including Coin Value Days Destroyed and Terminal Price.
Stock-to-Flow Model
Ratio of bitcoins in circulation relative to the amount of bitcoins annually mined, and this ratio's relationship with price
The Golden Ratio Multiplier
Uses Bitcoin's growth adoption curve and market cycles to identify both intracycle and full-cycle price highs.
Make smarter decisions about Bitcoin. Instantly.
Access the Bitcoin and Global Macro Charts that really drive Bitcoin’s price.
+40 chart alerts. Never miss critical levels on charts again.
Analysis newsletter. Manage your emotions at market extremes.
Private Tradingview indicators. See Bitcoin chart levels in real time!
Cancel anytime.
Any information on this site is not to be considered as financial advice. Please review the Disclaimer section for more information.